Electron Microscopy Lab
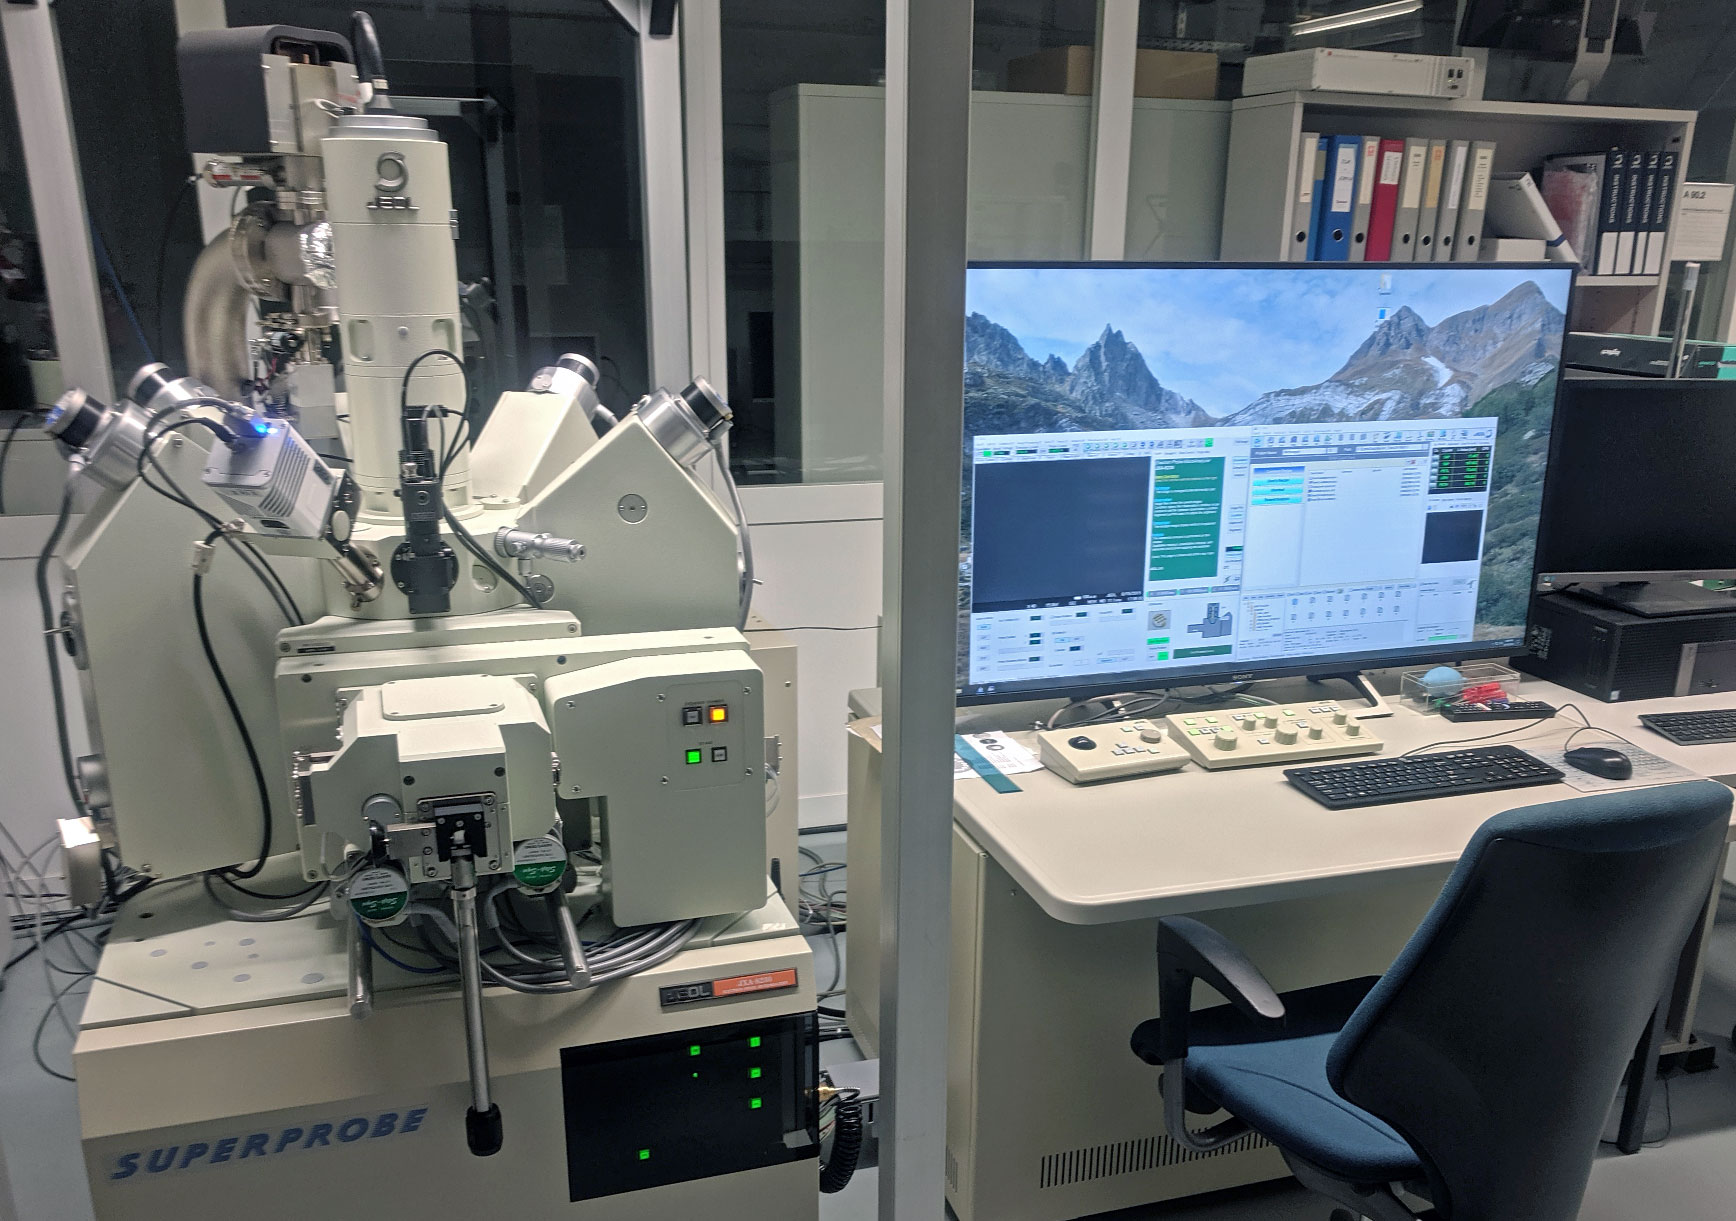
The Institute for Geochemistry and Petrology operates a new five-spectrometer JEOL JXA-8230 Electron Probe Microanalyser (EPMA) installed in spring 2019.
The Electron Probe Micro-Analyser
The instrument is equipped with a secondary electron (SE) and a backscattered electron (BSE) detector for imaging purposes. Five wavelength dispersive spectrometers (WDS) are used to obtain precise and accurate quantitative analysis. Each WDS is equipped of up to four X-ray monochromators and either a P-10 or a xenon X-ray counter. The additional silicon-drift energy dispersive spectrometer (EDS) from JEOL provides quick element identification and can be combined with the WDS for quantitative EDS-WDS analysis.
The EPMA provides precise quantitative chemical analyses of elements from B to U at a high spatial resolution. For typical silicate analysis, resolution of around 1 cubic micrometre is expected, and can reach the sub-micrometre under special circumstances (low voltage analysis, dense phases). Depending on the analytical conditions, the detection limit ranges between 10 and 200 ppm (higher for light elements B to F). For quantitative analysis we maintain a large set of well-characterized standards of various compositions for a nearly all elements. Solid specimens are prepared as sections with polished surfaces from natural rocks, minerals, metallic alloys or from experimental run products. Due to sample holder restrictions, it is highly recommended to have samples mounted as polished petrographic thin-section or 1-inch round mounts.
The instrument is controlled using either the native JEOL software, or in combination with a third-party software Probe for EPMA. Both programs provide equally good quality data, but the latter third-party software has superior analytical capabilities and versatility for precise and sometime more accurate data acquisition, especially in difficult samples (e.g., beam sensitive materials, complex multi-element phases, etc.). We provide several modes of operation:
- Full quantitative mode: All required elements are analysed with a spot sizes of ~1 to 20 micrometre diametre, depending on the stability of the phase and/or other spatial constrain from the sample size.
- Qualitative element distribution maps: Variations of the concentrations of selected elements are visualized as a map view. This allows relative variations of element concentrations across different phases to be determined and is typically applied on chemically zoned minerals (e.g., garnet, plagioclase, diffusion profile, etc.) or finely intergrown matrix.
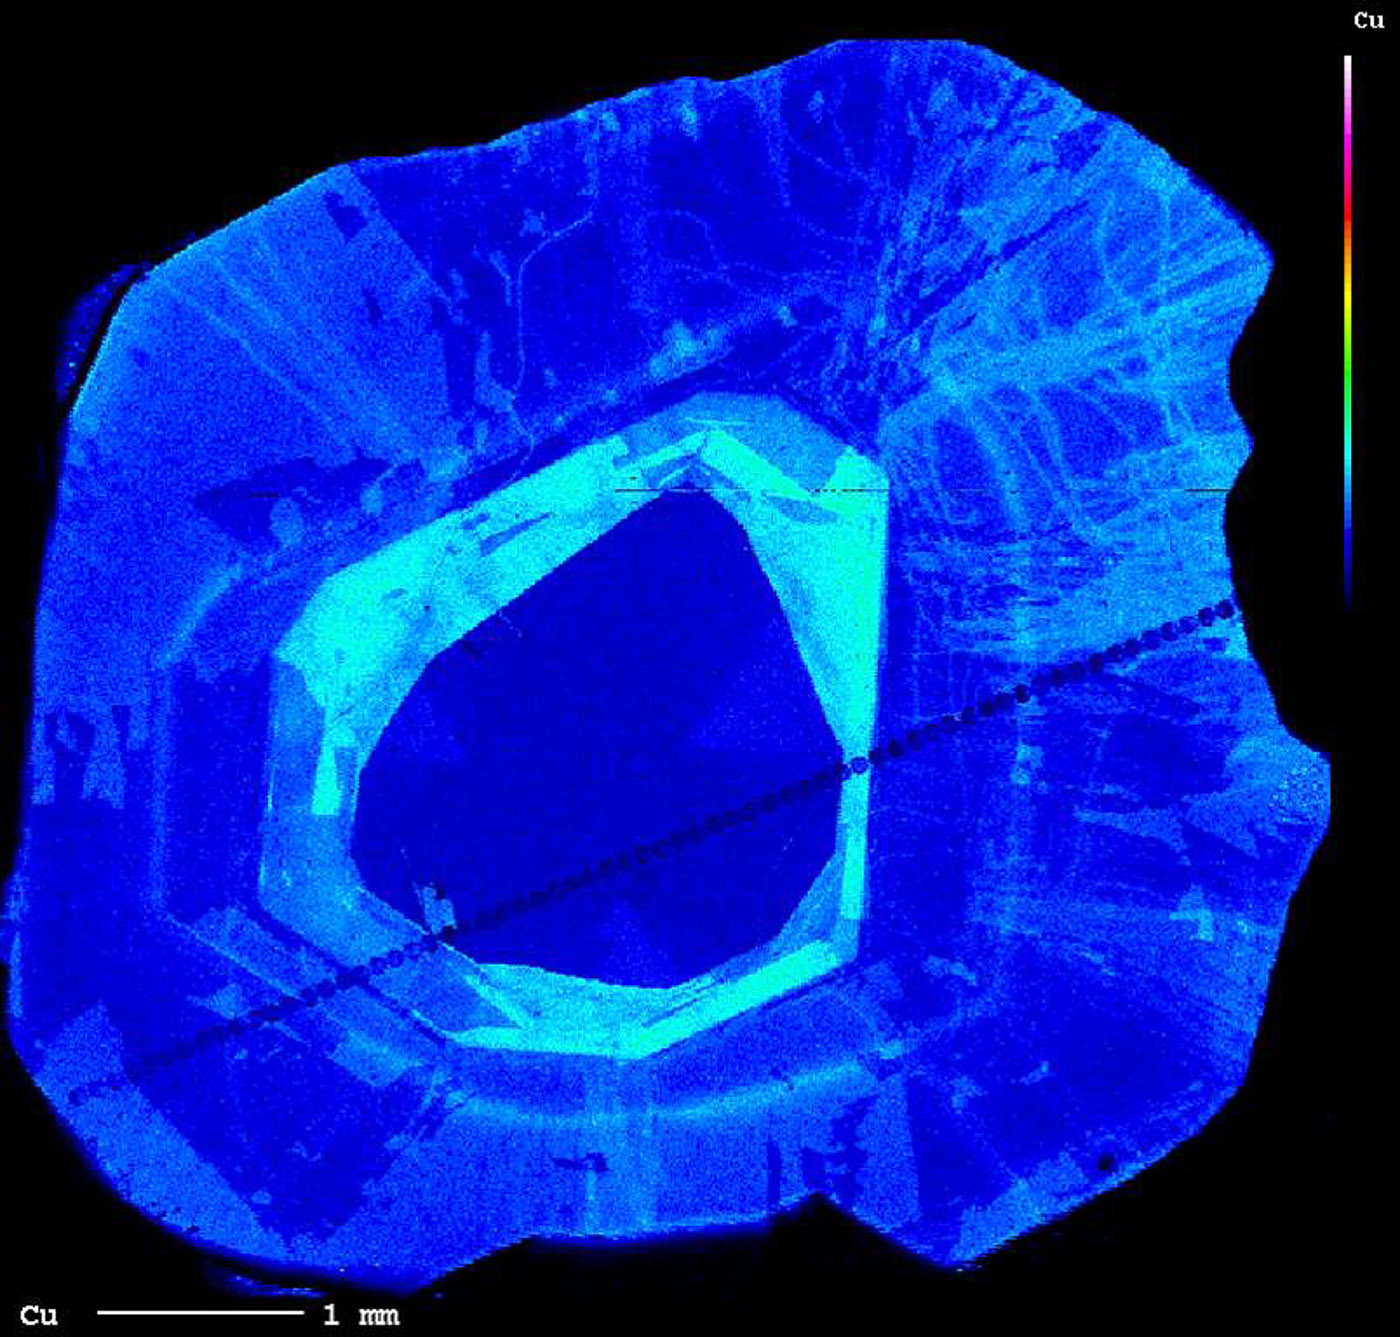
- Quantitative element maps: With the help of the third-party software, the qualitative element maps can now be quantified with the same accuracy as a classical quantitative analysis. A couple examples are provided below, along with a talk by Julien Allaz on quantitative element mapping by EPMA.
- And more!
Some examples acquired on our instrument are listed in the lab impressions below. Additional details on the instrument setup along with a complete database of our microanalytical standard collection and several other microanalytical tools is available on the external pageDe-MA website.
An (incomplete) manual of our specific instrument is available at DownloadD-ERDW / IGP EPMA, User Manual (v1.0, October 2019) (PDF, 17.5 MB).
Lab impressions
-

JEOL JXA-8230 electron microprobe equipped with five wavelength dispersive spectrometers (WDS) and one energy dispersive spectrometer (EDS; installed in Spring 2019). -

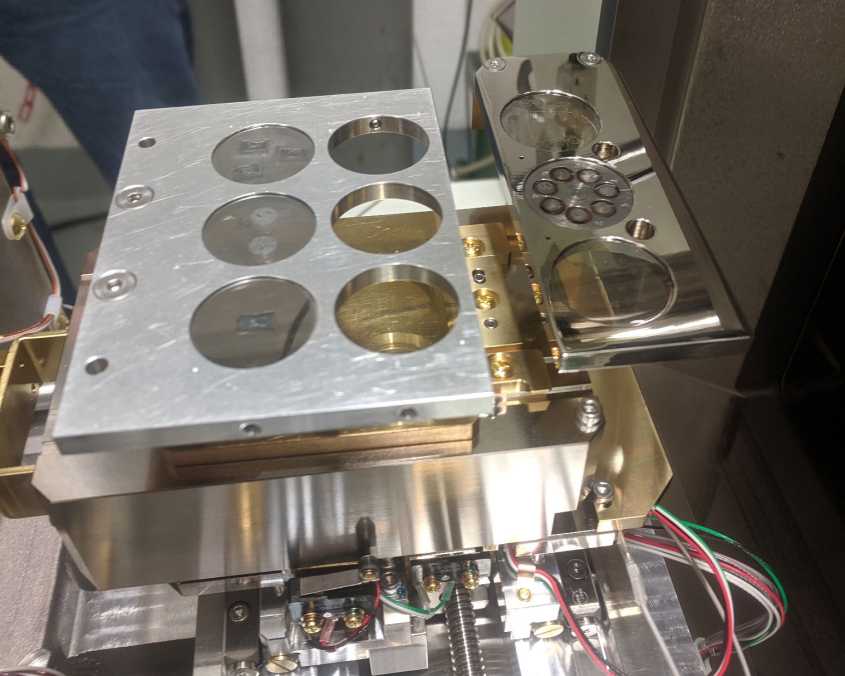
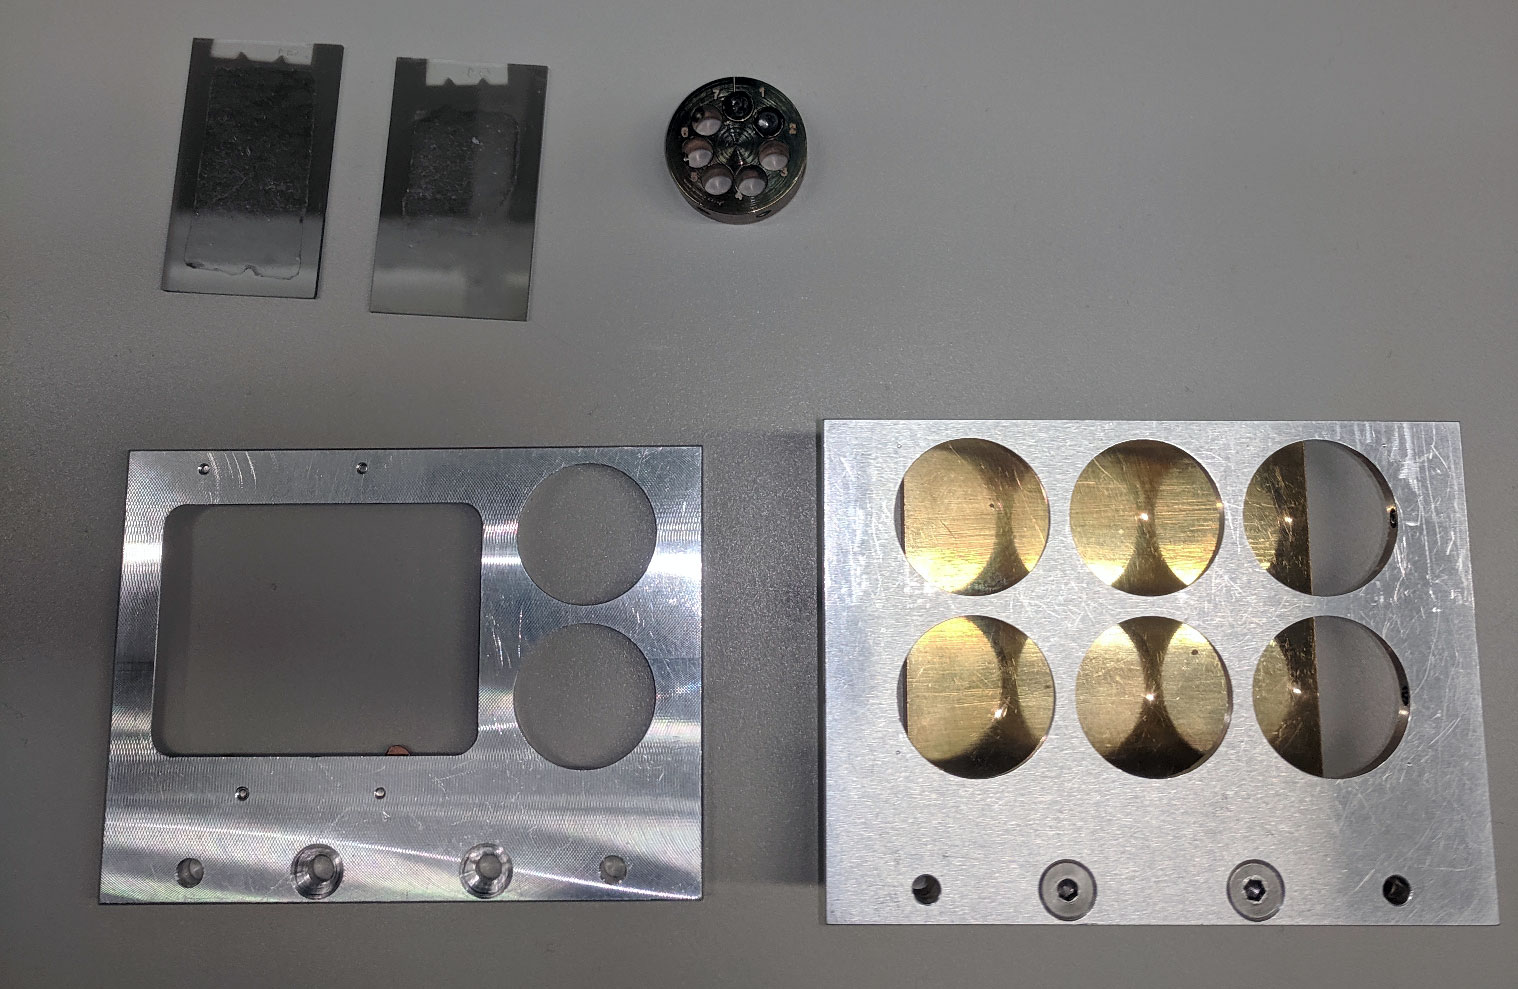
Polished thin sections and 1-inch round mounts are the preferred sample size. Three common holders are available (two shown here): 6 round mounts, 3 thin sections, or 2 thin sections and 2 round mounts. -
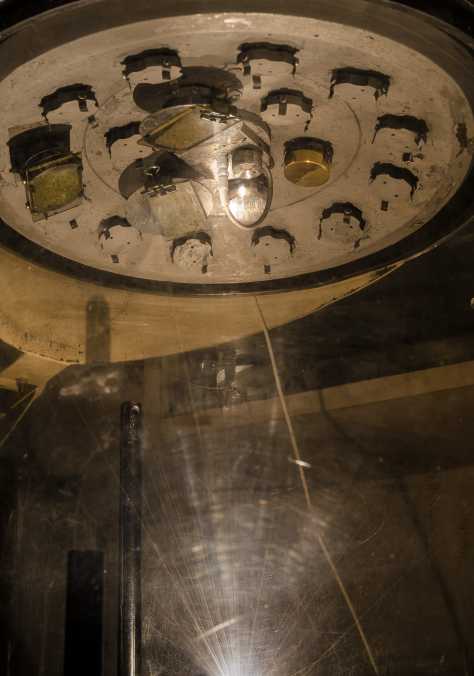
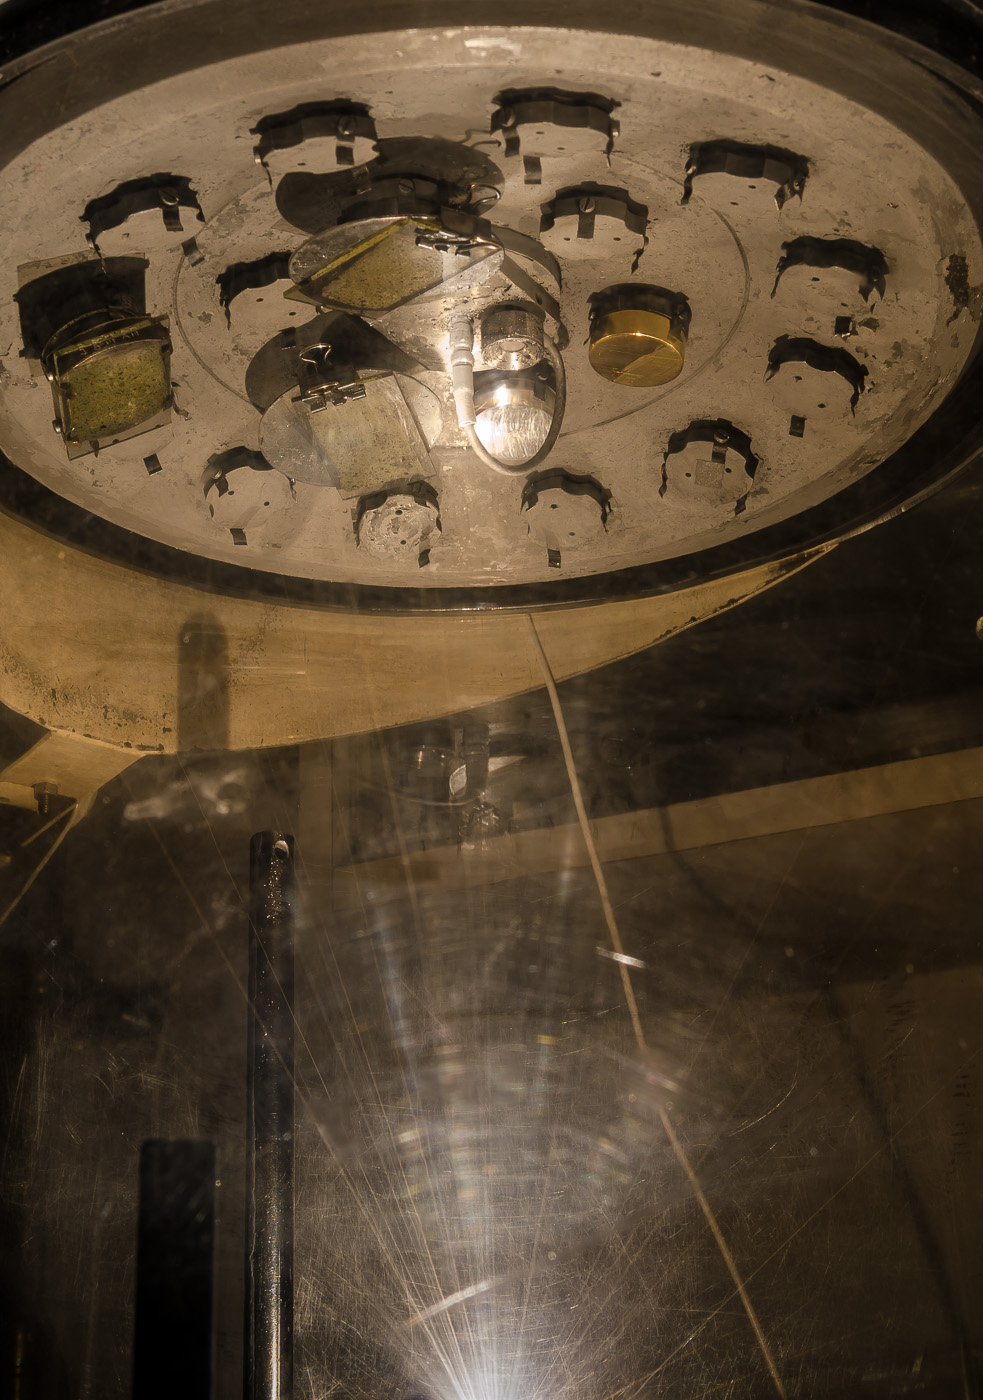
The sample chamber has been opened for inspection of the sample stage. The three permanent standards blocks are visible on the right-side. -
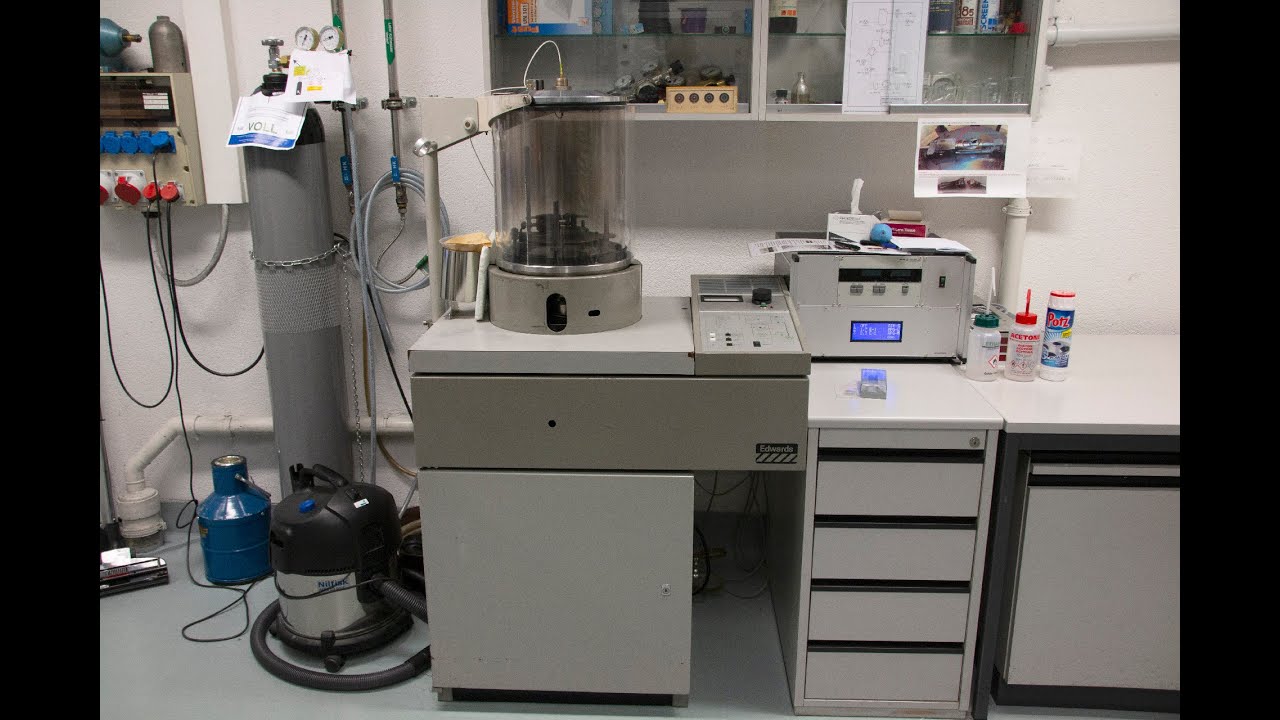
Large-chamber carbon evaporation system (fully refurbished Edwards coater). -
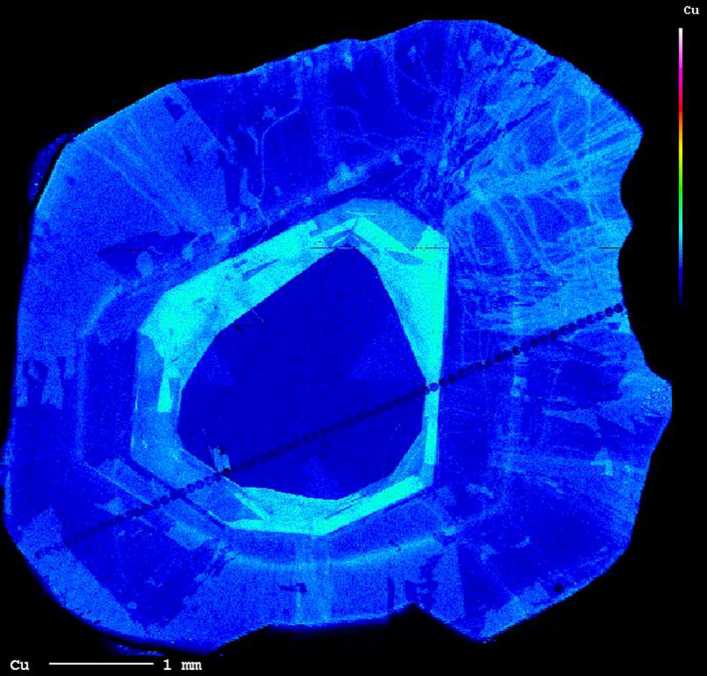
Cu-distribution map in Elbaite (Tourmaline). -
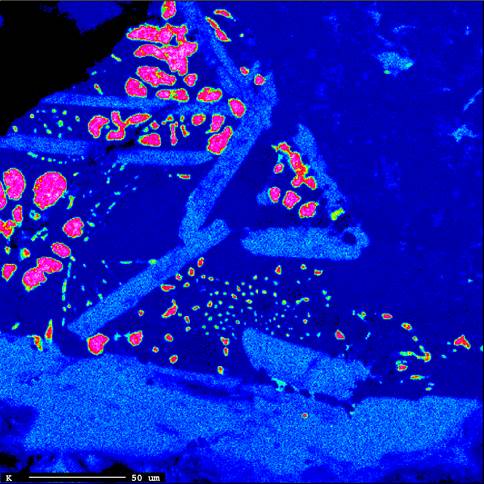
K-distribution of carbonatite lava from Ol Doinyo Lengai Volcano, Tanzania.


Scanning Electron Microscope
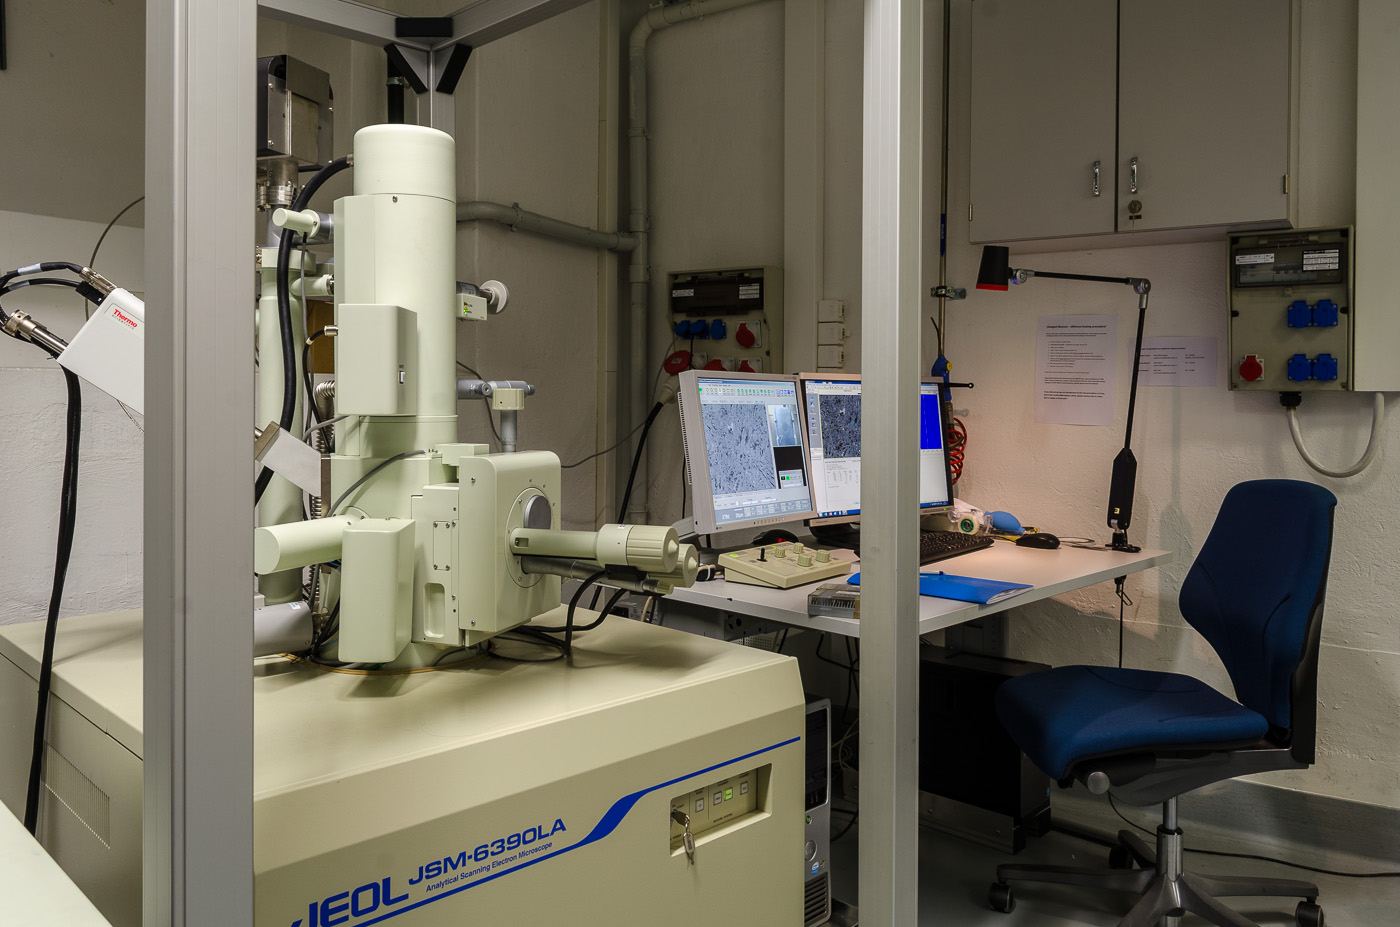
The electron microscopy lab also houses a JEOL JSM-6390 LA scanning electron microscope (SEM) equipped with a secondary electron (SE), a backscatter electron detector (BSE), a Deben Centaurus panchromatic cathdololuminescence, and a Thermo Thermo NORAN NSS7 EDS system with a 30 mm2 Silicon-drift detector (SDD) for chemical analysis and spectral imaging. An "in-column" Farady-cup is can be inserted to measure the actual beam current and with the help of our large standard collection, accurate standard-based quantitative analysis can be obtained. For quantitative analysis and optimal imaging capabilities, samples must be carbon-coated and with a flat and well-polished surface. Our expertise focusses on natural rocks, minerals, synthetic products, and metallic alloys. Non-coated and non-conducting samples can be imaged and analyzed qualitatively in low vacuum mode.
A complete manual of our specific instrument is available at DownloadSEM User Manual - Pathfinder (v2.0.2, May 2022) (PDF, 10.8 MB).
Lab impressions
-

JEOL JSM-6390 scanning electron microscope. -
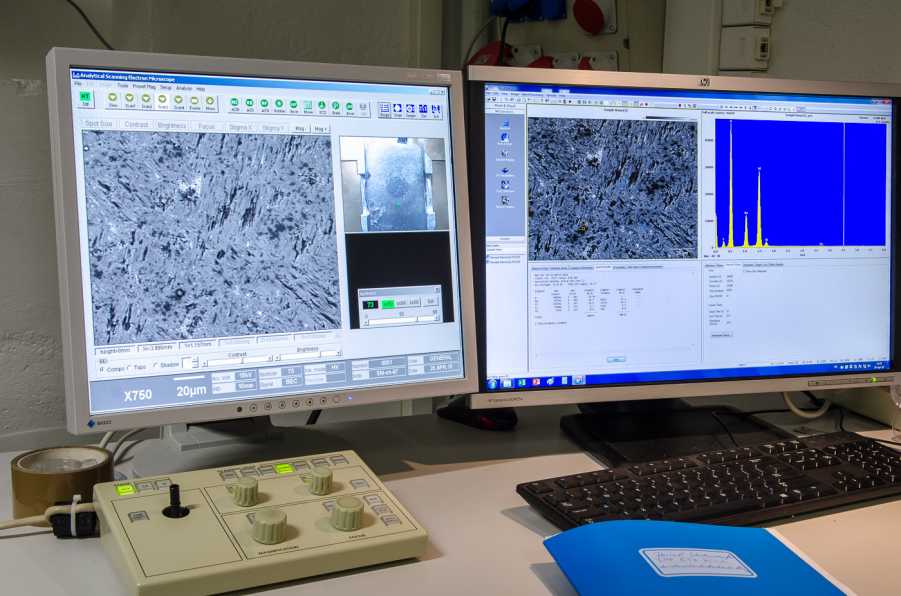
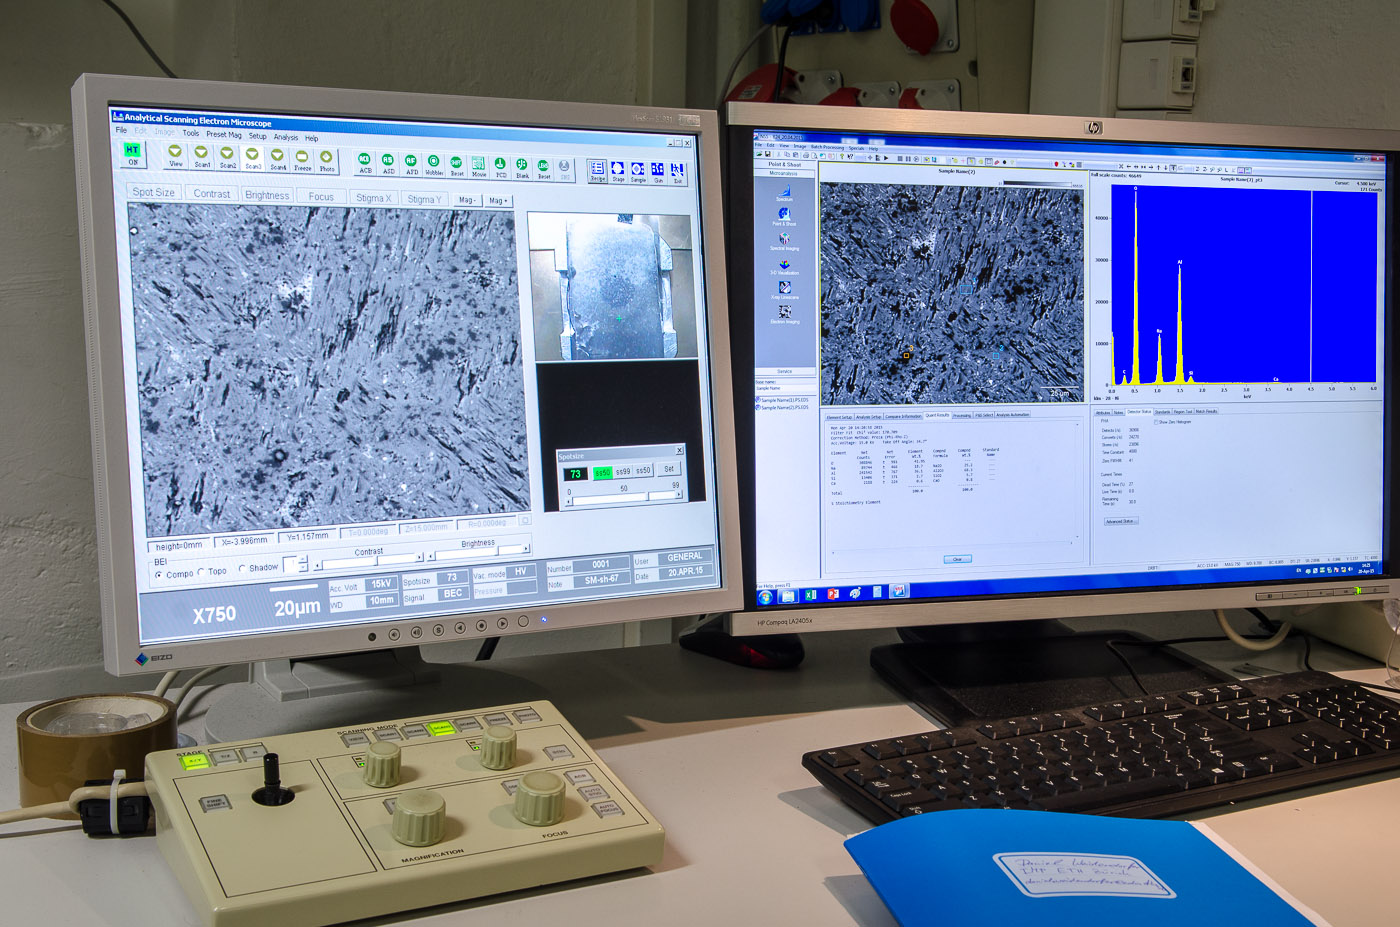
SEM control station (left) and NORAN NSS7 EDS software (right). -

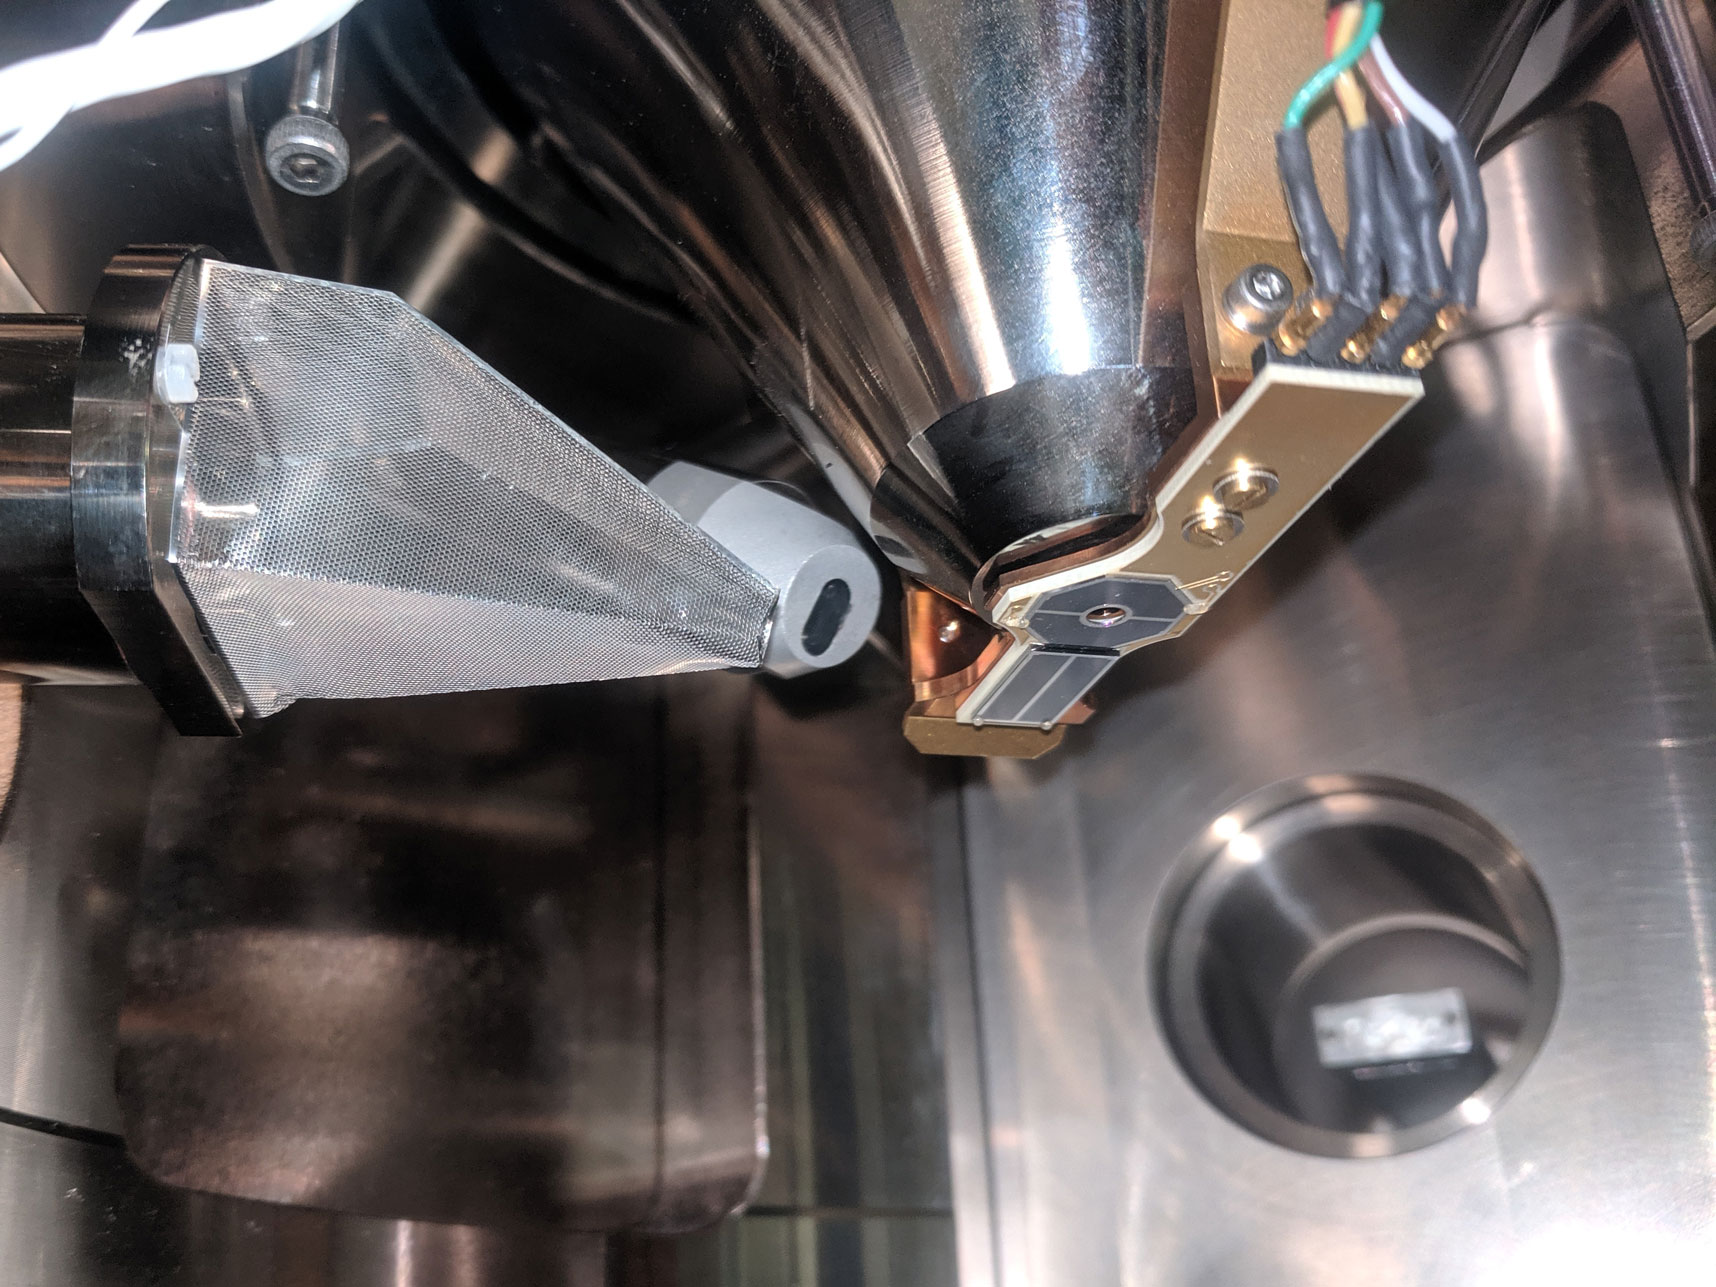
View of the SEM chamber with the various detectors installed: SE, EDS, BSE, and CL (left to right). -
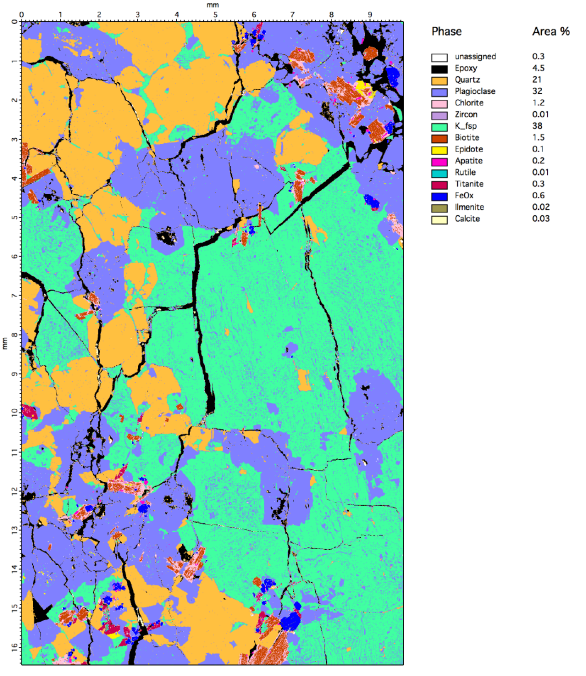
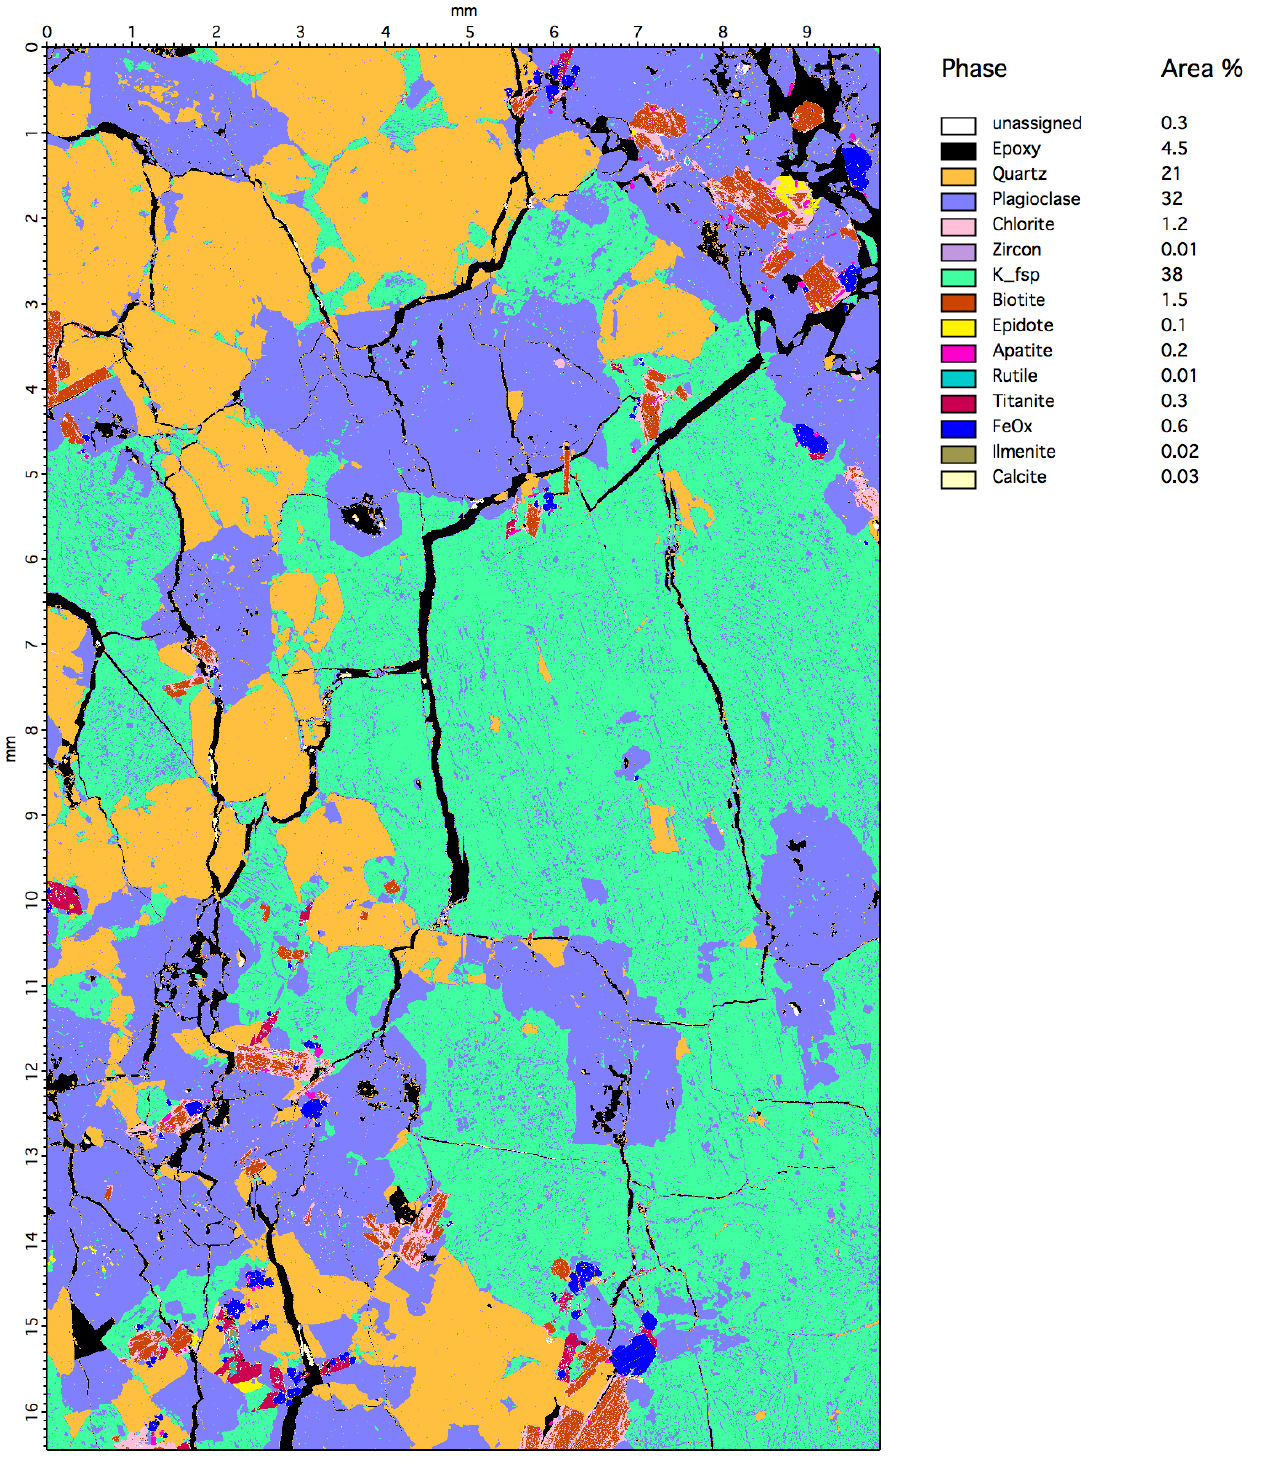
Phase map of a tonalitic rock created using our homemade software from NSS raw data. -
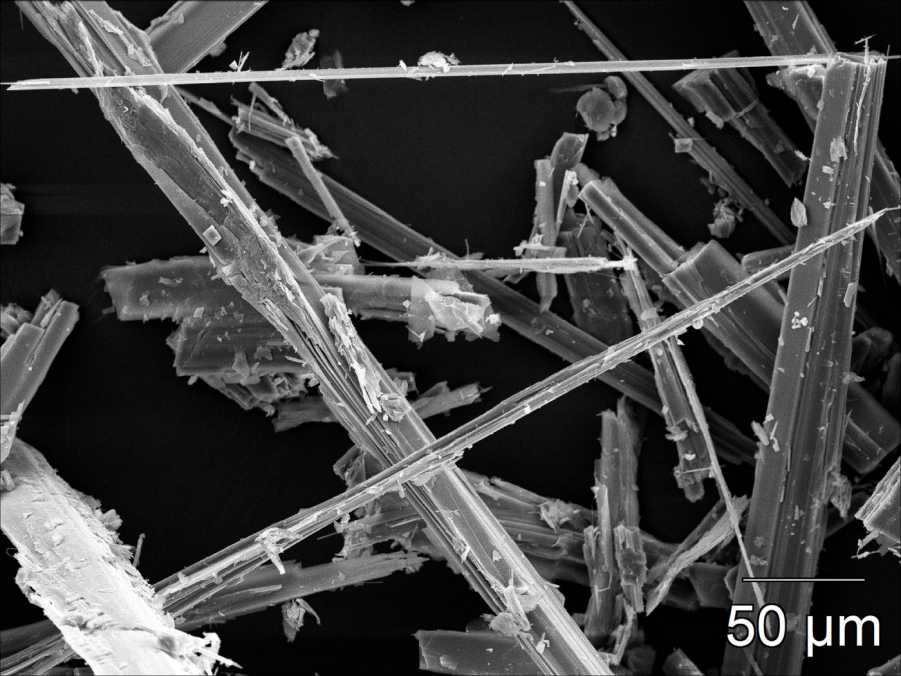
Secondary electron image of asbestos fibres.

The SEM provides the following operation modes :
- Imaging with a SE and BSE detector at high vacuum
- Imaging with a BSE detector in the low vacuum mode
- Qualitative EDS analyses for phase identification
- Quantitative EDS analyses based on calibrated standards and beam current measurements
- EDS spectral imaging (also known as "element mapping")
- Qualitative EDS analyses for phase identification in the low vacuum mode.
Spectral imaging aquires a quantifiable EDS spectrum for each image pixel instead of intensities for pre-selected elements only. We use our homemade, freely available software package called external pageiSpectra for the analysis of such data, which enables e.g. phase mapping of entire petrographic thinsections (see gallery above) to be carried out.
Carbon coater
A fully-refurbished Edwards carbon coater is available in NW A 90.1 (rebuilt by Dr. Eric Reusser). The video here below describes how to use it.
External facilities
Additional and complementary microscopy techniques can be accessed at the Scientific Center for Optical and Electron Microscopy (ScopeM) of ETH Zurich.
Contact
Inst. für Geochemie und Petrologie
Clausiusstrasse 25
8092
Zürich
Switzerland